
COVID-19 IN SOUTH AFRICA – A SUMMARISED HUMAN ACCOUNT
The ramblings of an informed mind.
(This story includes pictures!)
A lot of what is mentioned below is based on a proper analysis of the information that was studied. Due to the fact that this is not only meant to be an accurate analysis of the data, but also an information piece for the general public, it is not possible to write it in a style of language that is reserved for one exclusive section of the population (those with a scientific background). Due to this, what follows is an attempt to compile the information in an easily understandable format, but to also make it more interesting and give it a bit more of a personal touch. – Although this paragraph still sucks!
A bit of background
As I am naturally inclined to research everything, it was obvious that COVID-19 presented the opportunity to do research. Basically, at the start, when the news was still fresh, there were reports of this “novel” virus that caused a large number of deaths. Related to the fact that I am a smoker, it was obvious that my attention would have been drawn to some of the first reports, where it was indicated that the smokers who got a severe form of the disease, had the worst outcomes. This was basically due to the virus mostly affecting the lungs and we know that all smokers’ lungs are not the greatest anymore. Or so they say. A high percentage of smokers who got a severe form of the disease ultimately died, according to the initial reports. From the first report, it was also evident that older people (60+) suffered the worst outcomes, while it was also clear from the statistics that the greatest number of infections occurred in people in my age group (approximately 45 – 55 years old).
In South Africa, the first steps were taken early in March. Social distancing became a buzzword. We postponed sports practices to be careful and the sport governing followed about suit about one week later. On the 26th of March South Africa went into a “hard lock-down”. This is put into quotation marks, to emphasise that the “lock-down” was nothing more than a restriction on those who allowed themselves to be restricted. We, the fools, also known as the general South African public, were placed under house-arrest for crimes we did not commit. Our freedoms were taken away. Most people were separated from their extended families. We were not allowed to socialise with friends. Our constitutional rights were trampled on and we were not allowed to be HUMAN. We were not allowed to buy alcohol and we were not allowed to buy cigarettes. (A bit more of this later.)
Stay patient – Pictures coming soon!
Time to read / research:
Because of the lock-down and our lives being taken away, I had a lot of time to read on the topic and also to do some research. Related to this we, of course, informed by the South African Government that we should not trust any other sources. Of course, with me being a sceptic, that raised a large RED flag. The moment someone tells you THAT, it is obvious that they are hiding something from you. Due to this I started to read some more and preferably from other sources too. I used as many sources that I could find. This cause me to quickly realise that the least accurate source of information was the South African Government website.
Hand-in-hand with the Government programme there were further completely irrational actions. They “informed” the public, that they should not stigmatise those who get infected, but at the same time their own messages that were sent via text messages to mobile phone users were meant to stigmatise and create fear. Basically, the messages came down to “COVID kills, you are all going to die! Stay locked up!” I do not have those messages anymore as I blocked that number.
At the same time, Millions of South African were forced into their home, but at the same time, some of the most vulnerable populations (the poor and the under-privileged), were forced to collect food parcels in huge crowds of people. After receiving their food parcels in this environment, they had to go home to be locked up in a small space with their closest family, which would have been the ideal conditions for the transmission of the virus.
After only two weeks of the start of the lock-down the number of COVID infections started to rise. At this point in time, it was already clear that the lock-down had failed miserably. Like many others, I supported the initial steps taken, but to not adjust to the fact that the lock-down was a failure, was the biggest failure. (MAJOR FAILURE NO. 2) The first failure is discussed later on.
The ban on cigarettes and other tobacco products
(MAJOR FAILURE NO. 3)
This aspect deserves its own section, as it also highlights the unscientific and inflexible approach followed by a government hopelessly lost in ignorance and corruption. A government that probably killed many more than it saved!
Due to the narrative that cigarettes are bad and added to the point I made above, that the initial studies indicated that the smokers who got a more severe form of the disease, the South African public (smokers), were ambushed by incomplete and vague lock-down regulations. However, mere days after the lock-down a number of articles were published indicating a disproportionately low incidence of COVID infections in smokers. This means that while it was true in those who developed severe symptoms, smokers were the most likely to end up in ICU, it was also true that much less smokers got infected in the first place.
(Even in the Government court papers filed in the BATSA case they admit this fact. In paragraph 128.4 of their court papers the following is stated: “Zhang et al conclude that ‘The outcome of SARS-CoV-2 infection in smokers may be more severe’ even though smoking populations were less likely to be infected.”)
Just a quick summary of the findings of all studies indicate that current smokers were approximately 5 to 10 times less likely to be infected. Smokers however, when infected, were approximately 1.4 times more likely to have severe outcomes. In contrast ex-smokers were twice as likely to get infected and also had the similar increased rate of severe outcomes, like the current smokers. To sum up it can be stated like this:
- Current smokers were 5.35 times less likely to die from COVID.
- Ex-smokers were 2.8 times more likely to die from COVID.
- Quitting smoking during the “pandemic” increased the chance to die 15-fold.
While I initially thought about quitting at the start of the lock-down, the outcomes of these studies convinced me that it was a bad idea to quit at this stage. We I cannot deny that smoking may be unhealthy, but I am not an idiot, I was not going to allow the government to use me as an experiment (which actually also failed). Due to this I, like many others went out to search for cigarettes. Initially smokers were able to get a hold of “legal” cigarettes that were sold at inflated prices. I initially could go to one place where I could get some cigarettes, but after about two weeks the supply dried up. For a few weeks it was a “mission” to get cigarettes. I sometimes involved driving from possible “supplier” to another possible “supplier” to be able to finally get some cigarettes. My feeling was that if the government was willing to kill me to prove a point, I was willing to also be a “super-spreader”. My argument was based on the fact that I believed that we all will be exposed to the virus at some point in any case (again based on the lock-down that had already failed during the first two weeks). I was not willing to sacrifice my life for something that would have been inevitable in the end. The lock-down had already failed. This point will be PROVEN in the sections below.
In this section I could also discuss the further unintended consequences which includes an extreme increase in the illicit trade of cigarettes, the loss of billions of Rands due to taxes on the legal sale of cigarettes being lost. Due to these aspects already being addressed in numerous articles in newspapers and magazines I do not see the need to repeat it.
The research
Due to the differences of the numbers of deaths reported from different sources and the extreme fearmongering going on world-wide, some of it related to the upcoming US elections, research was conducted using a number of sources. Searches were also conducted to find new sources of information. It quickly became apparent that the answers would not be obtained from a single source and least of all, from the official figures supplied by Government. For that reason, all the sources were used and compared to events in other countries. The shape of the curves of infection rates were compared, but the specific development of the country and the background to the age, mobility and general socio-economic factors were also considered. (It is not included here, but the process on analysis is long and tedious, a bit like this post, at this point…)
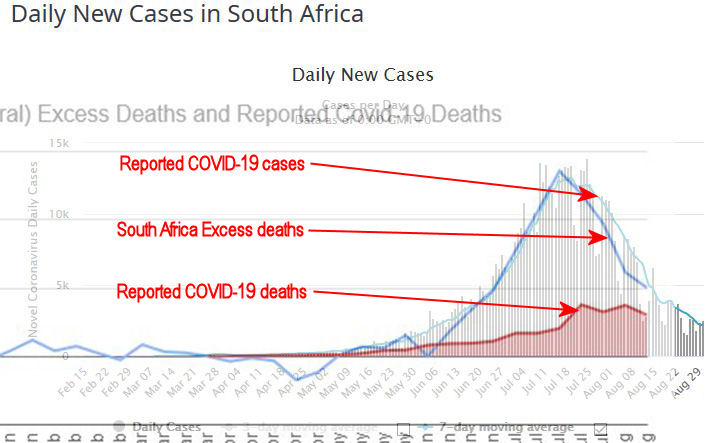
The main source of information of the this was “Worldometer”, which was visited on a near daily basis and on each visit the top ten to 15 countries affected were compared to each other. On about the 14th of July 2020, I read an article in the newspaper “Beeld” where the government alleged that South Africa would reach the peak rate of infections at about the end of September. Based on what I have gathered up to this point, in relation to the graphs, I was convinced that they were once again completely wrong (MAJOR FAILURE NO. 3). On that same day, I decided to make a prediction. That prediction was that South Africa will reach the peak of its infections within 2 weeks. Interestingly on the 19th of July, the seven (7) day moving average of the curve published on Worldometer reached its peak. It was only 5 days after my prediction and within the predicted two weeks. This curve is shown in the first image included below.
(Ahhh, finally we get to the pictures!)

Picture 1:
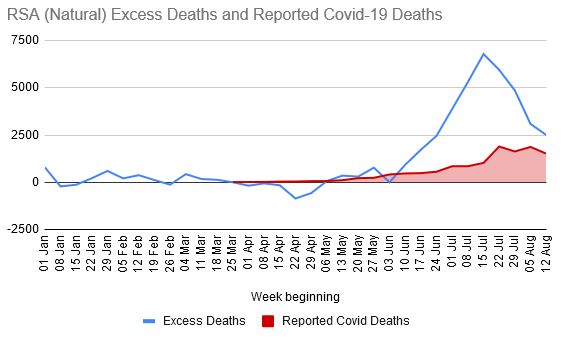
At about the same time I started my research, I did comparisons of the excess deaths in other countries. Interestingly in the early stage of the lock-down, the number of excess deaths in South Africa was negative. This means that due to the lock-down a few lives were probably saved due to less road traffic accidents, etc. It is also important to note that in the first few weeks all other associated risks were reduced and this was a natural result of that. This also probably created a false sense of security.
From the beginning of May there were however a small number of excess deaths which were not extreme, but considering that the other risk factors were reduced, it was already probable that these deaths could be connected to COVID. From about the start of June, the excess deaths increased substantially. As the excess death were recorded on a weekly basis, the curve showed a reasonably high value on approximately the 15th of July and after that there was a reasonable sharp drop in the number of excess deaths. At that point (before reaching the peak, I initially doubted my own prediction (we have to remember that the numbers of excess deaths are only published a week later than the other statistics). Amazingly, in the following week, there was a continuation of the sharp decline which confirmed my initial prediction of the peak. The number of excess deaths is indicated in Picture 2, below.
Picture 2:
At this point, it needs to be pointed out that there was no match between the reported COVID deaths and the excess death rate in the country. However, the shape of the curve of the excess deaths seemed to roughly match the shape of the curve of the reported COVID infections. At the time of planning to write this post, I have not done a comparison yet. I then opened the image of the reported COVID cases in a photo editor and overlaid the image of the excess deaths on top of it. I adjusted the horizontal scale so that the dates of the two graphs correspond, in order to match the horizontal scale. On the vertical scale the overlaid image was stretch down, so that the zero point on the infection scale correspond with the zero excess death line and Picture 3, shown below was created with text merely added to clarify which lines refers to which values.
As explanation, it just needs to be noted that the vertical scale of the excess deaths are of course stretched just to show the shape of the curves. It is also clearly visible that the shape of the curve of the reported COVID deaths does not match the curve of the reported COVID infections. However, the curve of the excess deaths closely matches the curve of the reported COVID infections. This clearly indicates that the reported COVID deaths differ from both the number of infections and the reported excess deaths, while the reported COVID infections and the reported excess death corresponded close to perfectly. This indicates that the excess deaths in the country were in fact DIRECTLY related to the number of COVID infections and the number of official “reported” COVID deaths were a made-up number.
Picture 3.
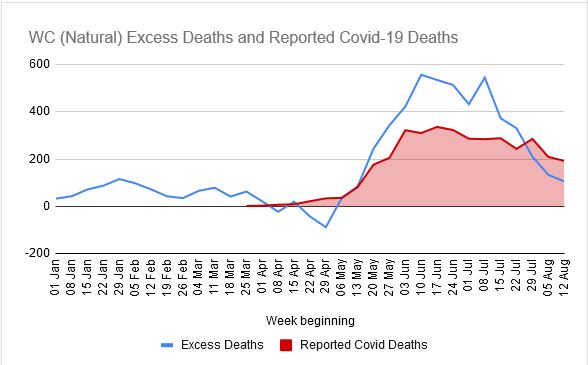
The above picture clearly illustrates that a large percentage of the cases were not reported. A further comparison was also done between the various provinces and the images are included below. Picture 4 shows that there is a relatively small difference between the reported deaths and the actual deaths in the Western Cape. Roughly estimated from the graph there appears to be a 30% rate of under-reporting. One can however see that the graphs follow a similar shape. This means that even where it was under reported, there were attempts to accurately report the number of COVID related deaths in the Western Cape.
Picture 4:
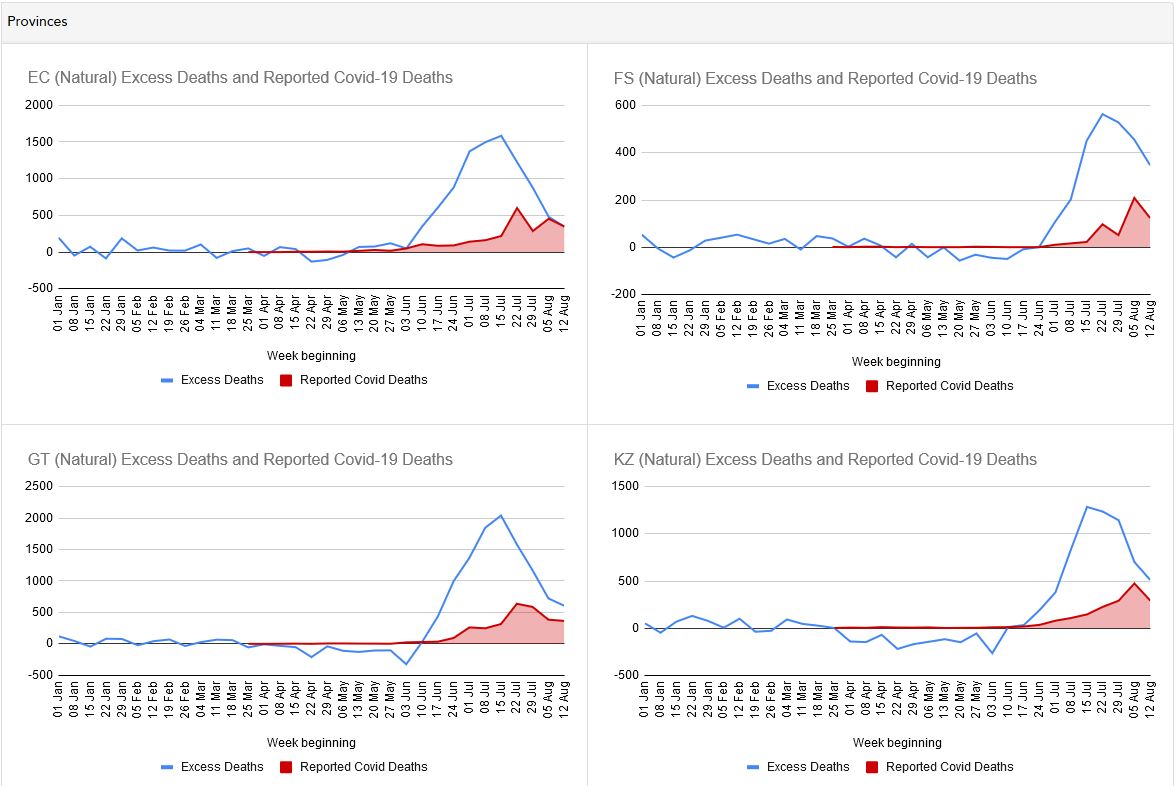
When comparing the above to the graphs from 4 other provinces (EC, FS, GT, and KZ), it is just as clearly evident that the under-reporting was the greatest in these areas. The differences in the graphs also indicate that the greatest amount of under-reporting occurred early during the initial spread of the virus (disease). Only later, from approximately the middle of July, the reported numbers started to move closer to the actual numbers. The reported numbers from these provinces are shown in Picture 5, below.
Picture 5:
If we now go a little further in looking at the shapes of the graphs, at a time when the economy is finally being opened up (level 2), it is evident that there is no noticeable rise in infections. This indicates that the pandemic basically has run its course. While there are more people in contact with others on a daily basis, the rate of the infections is still dropping. This means despite all the so-called preventive measures, the virus managed to find its way right though most of the population, so that we are now close to the so-called “herd immunity”. Despite the “lock-down”, infections increased at a high rate, up to a point where it naturally started to decline. In fact, it appears that the lock-downs in fact forced infected people to remain in close proximity to other and this, due to the ineffectiveness in preventing the spread, it in fact led to an increase in the spread of the infections. At this stage the development of vaccines is academic in nature and does not serve any current purpose.
The numbers:
As we now know that the “excess deaths” number is probably the REAL number COVID deaths and the “officially reported” COVID death is just some “made-up” number, if we want to do a statistical analysis of the death rate, we need to use the number of excess deaths. The most current numbers, at the time of writing this indicated that South Africa had 39 087 excess deaths on the 18th of August. (Source – South African Medical Research Council)
To do a proper comparison, this will be compared to the reported numbers on the same date. On the 18th of August, the reported number of infections was 592 144, while the reported number of COVID deaths were 12 264. This means that 26 823 actual COVID deaths were not reported in the official numbers. Stated differently the actual number of COVID deaths was approximately 3.2 times higher than the reported number. Or this can also be stated as “approximately” 68% of the COVID related deaths were not reported.
Confession: On the 14th of July, I also predicted that the final number of COVID deaths would be close to approximately 15 000. This was however based on the reported death toll, that was severely under-reported up to that stage, by a factor of more than four (4) initially. I will therefore admit that based on those under-reported numbers, my prediction was also completely off the mark.
It can also be seen that the reported number of COVID deaths are now (at this late stage) much closer to the actual death rate (excess deaths). This also means the under-reporting is less severe. Whereas it was initially under reported by a factor of 4, on the 18th of August the under-reporting for the total period was by a factor of 3.2. Extrapolating, it is possible to indicate that this factor at this stage, would be in the order of approximately 3. That means that when the current number of reported deaths (2 September) of 14 263 is used, it should in fact be adapted by multiplying the number by 3. That means the actual number of COVID deaths would be approximately 42 789 (2 September).
When this (42 789) was now used to calculate the number of deaths per 1 million of the population, it indicated that the death rate in South Africa, at this point in time was 720 deaths per 1 million. When this is compared to the table below (table 1), it shows that South Africa would fall into the table at position number 4, with its actual death rate. Plainly stated, it means South Africa had the 4th highest death rate of any country in the World, When one further considers the other factors related COVID mortality, it is probable that a country like Belgium would have a much older population and San Marino similarly, would have an older population. It therefore actually indicates that if the average age of the population was factored in South Africa and Peru would basically be the two countries with the highest death rates.
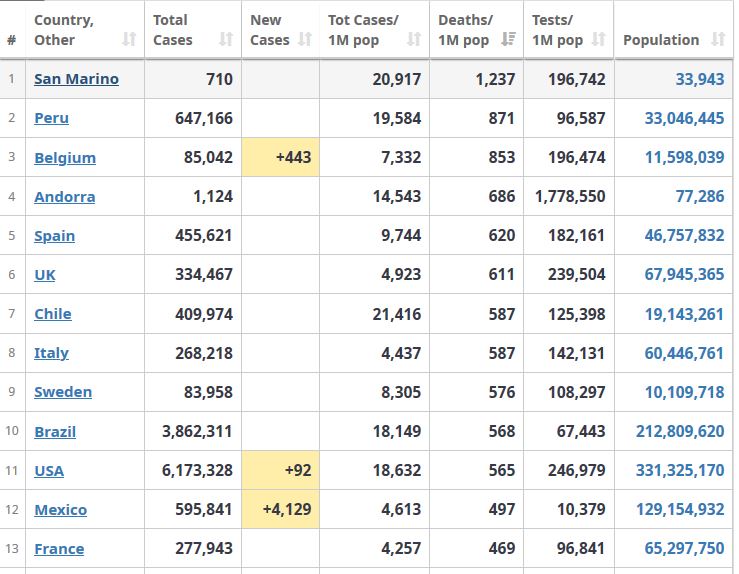
Table 1
Lock-downs
Notably, from the table table above, South Africa which would then have a death rate of 720 people per million, would be considerably above Sweden, with 576 deaths per million. Added to that Sweden’s average population age would also be higher than that of South Africa. Sweden is selected here, as it was the one country in the World who did not sacrifice their economy at the altar of fear. Sweden did not have a strict lock-down. Sweden did not force their population to wear masks (discussed in the next section). The only measures Sweden took, was limited to protecting the older population (where possible) and to restrict the number of persons at any gathering/s. At the moment Sweden is also basically past the pandemic, with the current rate of new deaths at approximately 1 to 5 persons per day (for the past month). At the same time South Africa had a daily rate of new deaths of approximately 150 to 200 persons per day over the same period. This means South Africa’s deaths per 1 million population is still rising to some degree, while that of Sweden remains relatively constant.
It should also be noted that Peru also had a strict lock-down. That means the two countries with some of the most severe lock-down policies had the highest death rates. From this it is easy to conclude that lockdowns do not work. As I indicated at the start, the fact that South Africa did not adjust to the failure of the initial lockdown, was MAJOR FAILURE NO. 2. This also means the lock-down in itself was in fact the first failure and the lock-down itself, was MAJOR FAILURE NO. 1. As indicated earlier, the fact that government failed to adapt, was the biggest failure of all.
Masks
South Africa was also one of the first countries to suggest the using of masks and it is even included in the regulations. As I am a cyclist that train at a reasonably high intensity of approximately 80% to 90% of my maximum heart rate, I immediately understood that the wearing of a mask would severely restrict breathing. I therefore researched the efficacy of face masks, but this research was not related to the restriction of breathing, because that was obvious in the first place. The research was done to determine whether face masks were effective at all. Would there be any advantage from wearing a mask?
In terms of this, the only scientific research was related to medical (surgical) masks. The research showed that a surgical mask is effective, but only for the first two hours. After two hours the chances of infection in fact increased. It increased to levels higher than with no mask used. Interestingly surgical masks are not recommended by our already proven to be incompetent government, but plain material (cloth) masks are. Firstly, there is no control over the manufacture of such masks. There is no specification that can be used to test whether they comply to any standard. This means in the case of cloth masks they may even be 100% ineffective from the first minute of use. If we now consider that a medical mask becomes a source of infections after two hours, we can only imagine what a cloth mask would be like after 8 hours of constant use.
This basically means the following factors also play a role in the wearing of a mask:
- The quality of masks is not certified or verified
- Masks are used for extended periods, but they should in fact be replaced after two (2) hours of use, (MAXIMUM)
- Masks are continuously put on and taken off a number of times during use
- Masks are continuously adjusted, as they shift
- Masks need to be disinfected properly, but rarely are (washing alone is no guarantee)
The above only shows that masks are in fact ineffective in the best-case scenario, but they may even be a much greater source for the spread of the virus in the worst case.
(MAJOR FAILURE NO 4)
Hydroxychloroquine
This is a medication that was in use for more than fifty (50) years and was used for a number of conditions. It was also used widely in Africa for the prevention of Malaria. I am not going to discuss all its uses, but only going to address it relevance in the treatment of COVID.
The use of Hydroxychloroquine (HCQ) was being tested and promising results were obtained. It was reported that the death rate decreased by approximately 30% to 40% in certain cases. It also needs to be noted that HCQ is a cheap medication with minor side-effects, except when given in lethal doses. (Pharmaceutical companies cannot make money from it, but they can make money from a vaccine, especially if everyone is forced to get the vaccine.)
(And then the US president, Donald J Trump mentioned it…HCQ)
The moment the above happened HCQ suddenly became “poisonous”. The medication suddenly had serious side-effects. Tests were conducted in Brazil, where patients, already close to death, were given lethal doses. Tests were conducted (data collected) where the patients with the worst expected outcomes, where its use would have been too late in any case.
In contrast in locations where tests were conducted with moderate use and early use during the infection, the death rate dropped significantly. It was also noticed that in countries where HCQ was widely used the death rate in those countries were generally lower than in the countries where it was not widely used. (The death rate in the rest of Africa, excluding South Africa can be used as an example.)
In relation to South Africa, it was indicated by the National Department of health that this was definitely not a recommended medication to be considered and they appeared to be proud of the fact that they did not recommend its use. We only need to fast forward a few months to get to the position where South Africa and Peru are the two deadliest countries in the world, when it comes to COVID. The failure of the South African Government and medical science fraternity to properly assess its possible use, based on the outcome (high death rate) can be described as MAJOR FAILURE NO. 5.
Ventilators:
In March a doctor from New York posted a video where he expressly indicated the danger of using ventilators on patients. At that stage South Africa was still getting ventilators and also using more money to secure even more ventilators. The fact that 80% to 90% of the patients that were put on ventilators was of no concern to them. As I say, at that point I (not a medical specialist) was already aware of the dangers of the ventilators. I was also aware of the advantages of using high flow oxygen in the treatment of patient. The first time high flow oxygen was mentioned as a treatment in South Africa was at the end of July. This was four (4) months after I already knew about this. And to imagine that the government alleged that they were following “science”. This was MAJOR FAILURE NO. 6!
Economy
Initially, at the start of the lock-down, I had no need to travel anywhere, except to go on a cigarette hunt, or to do grocery shopping. While out it was noticeable that the roads where I live, resembled a ghost town. All that was missing, was the tumble-weed rolling down the street. Obviously at times like those, it is easy to understand that the lack of vehicles on the road, the lack of humans walking between businesses and the lack of any visible economic activity would indicate that hundreds of thousands (or millions) of people could inevitably lose their jobs. It was already obvious to all sensible people that every week that the lock-down was extended, would lead to a more severe situation in terms of the economy. During these first weeks, even the biased and slow press speculated about the possible results of an extended lock-down.
During May, after the economy was partially opened for some sectors, I had to attend a number of consultations. While driving there, it was still noticeable, that even though certain sectors of the economy were functioning, that everything still remained largely “dead”. It now became clear that the hundreds of thousand could not only lose their jobs, but in fact they would lose their jobs. While this same cloud of doom was hanging over the city, it was also clear that we (the South African people) were losing millions of Rands of taxes related to the banning of the sale of certain products. It was a two-fisted blow to a stumbling economy. The economy, already downgraded to junk status, was now not only dying, but the government was injecting it with cyanide.
Even now, while we are in the alleged stage 2 of the lock-down, it is evident that it will take years to recover. While under the lock-down, when this economic devastation became evident, while economists warned of the outcome, while even the sleepy press reported on it, and while millions of South Africans felt it in their back pockets, the Government did nothing to counter the effects. In fact, they only managed to borrow more money that could disappear in an already proven to be, corrupt government system, adding a kick to the two-fisted punch. (MAJOR FAILURE NO. 7)
Summary:
Basically all of the above can be summed up in a few sentences and all of it is directly related to the major failures of government, their failure to adapt and correct their errors and admit their mistakes. The results as it currently stands can be summarised in the bullet points below, while the reasons for it is set out in slightly more detail above.
- South Africa has the second highest death rate due to COVID after Peru
- Approximately 42 789 South Africans have already died from/with the virus
- Lock-downs do NOT work
- Cloth face masks do not work
- HCQ works (in certain environments in certain conditions)
- The pandemic is over
- It’s too late for vaccines